
Discover
Research screener
Rank and filter the S&P 500 and NASDAQ-100 on valuation, quality, growth and whether free cash flow covers dividends and debt, then compare the shortlist side by side.
See it: Research screener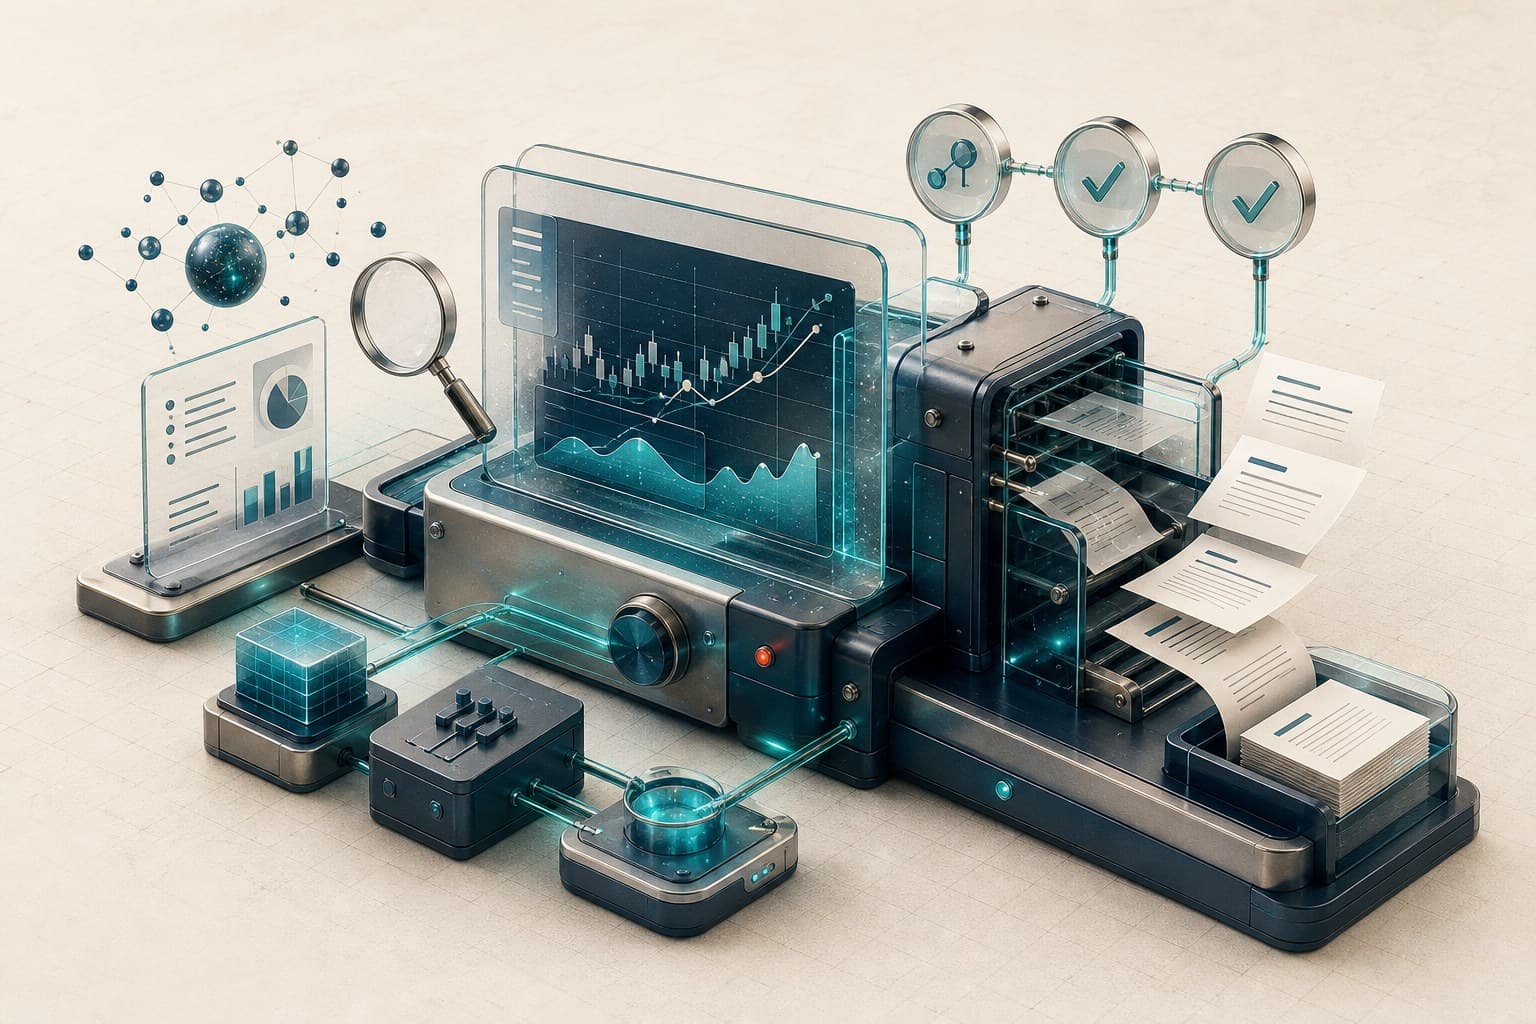
Private beta · Built in New Zealand
Make informed decisions, on evidence you can check.
Your broker shows a balance. Qubits shows the decision behind it — screen for durable businesses on the numbers that matter, bring any broker’s holdings into one private view, and turn your transaction history into an analyst report your accountant will actually read.
Sample workspace
Your dashboard, this morning
Screener
56 positive
Model
+4.2%
Builder
3
Reports
2
Portfolio value
NZ$126,480
Latest mark
vs SPY +76%
Positions to review
3 of 19MNSO
Loss review
NVDA
Earnings in 6 days
MSFT
Record high
Private by account
Isolated at the database level, not just hidden in the interface
No broker password
You export the file; Qubits never connects to your brokerage
Evidence, not opinion
Every figure carries its source and as-of date
Read-only
Qubits cannot place, cancel or execute a trade
How it works
Upload a transaction export from any broker. Sharesies and Hatch are read automatically; anything else you match once, column by column.
Qubits joins your holdings to scores, analyst targets, key dates and portfolio analytics.
Focus on material changes, upcoming dates and positions that need another look.
Turn the same transaction history into an analyst report, dividend records and an indicative FIF working paper to take to your accountant.
Inside the workspace
Discover
Rank and filter the S&P 500 and NASDAQ-100 on valuation, quality, growth and whether free cash flow covers dividends and debt, then compare the shortlist side by side.
See it: Research screenerMonitor
Bring positions from any broker into one matrix and read them by profit, value, units or portfolio weight.
See it: Holdings workspaceEvidence
Turn your transaction history into a full analyst report, dividend records and an indicative FIF working paper.
See it: Reports and tax papersPlan
Model contributions, retirement income and fund costs with assumptions you set and can change.
See it: KiwiSaver scenariosResearch that stays usable
Compare valuation, business quality, growth, opportunity, analyst targets and long-run risk in one dense table. Save the companies that matter, put them side by side, and carry the same context into your portfolio review.
Screener
Compare the context, not just the price
7 of 7 companies
| Signal | |||||
|---|---|---|---|---|---|
| NVDANVIDIA | Positive | 94 | 86 | 64 | -31% |
| ASMLASML Holding | Positive | 90 | 70 | 58 | -38% |
| MSFTMicrosoft | Positive | 88 | 73 | 51 | -28% |
| COSTCostco | Positive | 85 | 58 | 35 | -19% |
| ADBEAdobe | Review | 81 | 61 | 77 | -47% |
| NKENike | Review | 72 | 34 | 81 | -62% |
| PYPLPayPal | Review | 66 | 67 | 92 | -54% |
Illustrative rows, not current scores or a recommendation. A window is left blank when the price history does not cover it.
Holdings matrix
Every portfolio, one review surface
| Ticker | Sharesies | Hatch | All portfolios |
|---|---|---|---|
| MSFTMicrosoft | 28.0% | 31.4% | 30.1% |
| NVDANVIDIA | 36.7% | 14.0% | 22.6% |
| VGTVanguard Info Tech | - | 30.5% | 18.9% |
| COSTCostco | - | 24.1% | 15.0% |
| PYPLPayPal | 21.2% | - | 8.0% |
| CRWVCoreWeave | 14.1% | - | 5.4% |
Weight is each holding's share of the portfolio it sits in, so a column reads down to 100%.
Your holdings, properly connected
Import brokerage files, reconcile holdings, and read the same matrix by profit, market value, units held or portfolio weight. Notes and watchlists stay attached to the ticker instead of disappearing into a separate spreadsheet.
The analyst report
Two honest return figures
Money-weighted XIRR and time-weighted return, side by side
A benchmark that matches your timing
SPY bought on the dates you actually funded the account
Realised profit, done properly
FIFO lot matching, so a later purchase cannot flatter an earlier sale
A page per company you hold
One page each: price history, fundamentals, analyst context
Alongside it: dividend income records and an indicative FIF working paper for New Zealand investors — designed to support the conversation with your accountant, not replace it.
portfolio-report.pdf
5 sample pages of 117Qubits Finance
Portfolio Performance Report
Portfolio Overview
| Report period | 12 Feb 2022 to 25 Aug 2026 |
| Realised P/L (gross) | $57,428 |
| Unrealised P/L (open) | -$8,839 |
| XIRR (money-weighted) | +28.8% |
| Vs SPY, same trades | +76% |
Benchmark
Sector mix
Dividends
Decision support only, not financial advice · Prepared from your own broker records
1 / 5 · Portfolio overview
Research assistant · Limited preview
Still in limited preview. It is switched on per account as the pilot widens, rather than included with a plan.
Qubits Research Assistant
Approved account · read-only
Try a question
Questions and selected, minimum necessary tool results may be processed by OpenAI. Qubits does not store the conversation transcript. See privacy details.
Built for NZ adviser workflows
KiwiSaver scenario
Try the projection engine behind the Adviser planner
At 65, in today's dollars
$328,855
About $269 a week from 65 to 90, in today's dollars. NZ Super is not included.
Where the balance at 65 comes from
A scenario on assumptions you choose, not a forecast or personalised advice. Returns are the FMA's statement-projection assumptions after tax and fees at a 28% PIR; wages grow 3.5% a year and inflation is 2%. Employer contributions start at the 3.5% default and, like a 3.5% member rate, move to 4% from April 2028. The government contribution is 25 cents per dollar, up to $260.72 a year, while eligible. KiwiSaver rules as of 12 Aug 2026.
One matrix across every client portfolio, with notes, review cues and configurable detail columns.
A recurring, holding-by-holding read of one selected portfolio, on a cadence you set.
Client records, fund mixes and costs, first-home and drawdown modelling, and a client PDF.
Bring holdings in from PDF, image and CSV files as well as broker transaction exports.
Private beta plans
Founder
NZ$14/mo
Everything in Free, plus your private portfolio, the analyst report, dividends and the FIF working paper
Request accessAdviser
NZ$50/mo
Everything in Founder, plus multi-portfolio oversight, briefings, KiwiSaver scenarios and the assistant preview as it opens
Request accessQuestions
No. Qubits is a decision-support workspace. It does not provide personalised financial advice, does not recommend trades, and cannot place, cancel or execute an order. Every output is information you interpret and act on yourself.
You export the transaction file from your broker and upload it yourself. Qubits never asks for your Sharesies or Hatch password and holds no connection to your brokerage account. Imports land in your private workspace and nowhere else.
Any of them. Sharesies and Hatch exports are read automatically; for every other broker you upload the CSV and match its columns once - which is the date, which is the amount, and what your file means by "B". Adviser accounts can also bring holdings in from PDF and image files, or build a portfolio by hand.
It is generated from your own transaction history rather than a snapshot, so realised profit uses FIFO lot matching and the benchmark buys SPY on the dates you actually funded the account. It runs on request and typically takes ten to fifteen minutes; you are notified when it is ready.
A figure is shown only when the history behind it covers the window it is named after. If a company has eighteen months of trading, its three-year volatility is left blank rather than filled in from eighteen months. An empty cell is a real answer.
The FIF and dividend outputs are indicative working papers built from the records you supply. They are designed to support a conversation with your accountant, not to replace one, and they are not a tax return.
Every workspace is scoped to the authenticated account that owns it. Portfolios, holdings, reports and saved research are isolated at the database level, not merely hidden in the interface.
Approved accounts can ask read-only questions about research freshness, daily portfolio context, holdings, live quotes and the screener. It explains data Qubits already holds. It does not trade, and it does not give personalised advice.
It runs the same projection engine as the Adviser planner, on the inputs you choose and the FMA's statement-projection return assumptions. It is a scenario to explore, not a forecast of your balance and not advice about your KiwiSaver.
Private beta